No, really. Teslas are safe.
Posted by David Zaslavsky on — CommentsEvidently my post from a week ago on the rate of fires in Tesla electric cars compared to gas cars couldn’t have come at a more appropriate time. People are still harping on the recent string of Tesla Model S fires, despite the fact that — as I showed in my last post — there’s no evidence to suggest that the fire risk in a Tesla is any greater than that of a regular car. In fact, if anything it seems to be slightly less.
In my last post I kind of hinted at the fact that the rate of fires isn’t the whole story. Even if a fire does happen, your risk of getting injured or killed is different in a Tesla than a normal car. Something similar goes for other types of accidents. So if you want to tell whether Teslas are safe, what you probably should be looking at is the overall rate of injuries and fatalities for Tesla drivers and passengers, compared to the equivalent for gas cars. And that number tells a very interesting story: Tesla CEO Elon Musk has written a new blog post which emphasizes that not one person has ever been killed or seriously injured while driving or riding in a Tesla!
It’s an impressive record, but as Musk admits,
Of course, at some point, the law of large numbers dictates that this, too, will change, but the record is long enough already for us to be extremely proud of this achievement.
Well, I happen to know a thing or two about the law of large numbers (and so do you, if you read my earlier post). Let’s see what we can tell from the fact that Teslas have been driven as much as they have without a serious accident. Just how proud should Tesla Motors be about this?
Here I’m just going to apply the same statistical methods from my other post, except now focusing on the number of deaths and serious injuries, instead of the number of fires. So \(\mathcal{P}_\text{true}\) now designates the true, underlying probability per mile of a driver or passenger of a Tesla being seriously injured or killed for any reason related to the car.
As before, we don’t know \(\mathcal{P}_\text{true}\), but we do know that the corresponding event (death or serious injury) has happened zero times over a hundred million miles driven, \(\mathcal{N} = \SI{e8}{mile}\). If you followed my last post, then, you’ll understand how the maximum likelihood estimate (the “best guess”) of \(\mathcal{P}_\text{true}\) is just zero — that Teslas protect you perfectly from traffic-related injuries.
As much as Elon Musk (and a lot of other people) would like it to be the case, I think we all know that’s not realistic.
Time to move on to the a more sophisticated analysis. Remember that in my earlier blog post, I started with the formula for a Poisson distribution, which for a given value of \(\mathcal{P}_\text{true}\), gives the probabilities of experiencing various numbers of events (fires, in that case) per hundred million miles driven.
But remember, we don’t know \(\mathcal{P}_\text{true}\). We know the actual number of events that happened, which is \(n\). So as I showed in my previous post, we fix \(n\) to be that specific value, rename this quantity as a “likelihood” instead of a probability, and compare it for different guesses at \(\mathcal{P}_\text{true}\).
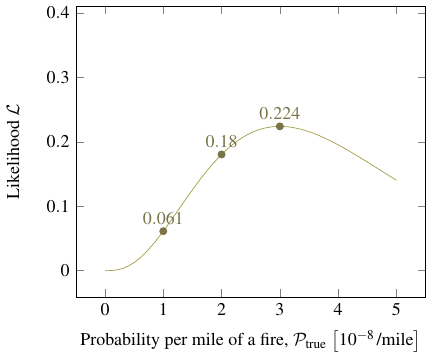
In the earlier post, an “event” was a fire, and there were \(n = 3\) of them in a hundred million miles. That gave us the yellow curve in this graph:
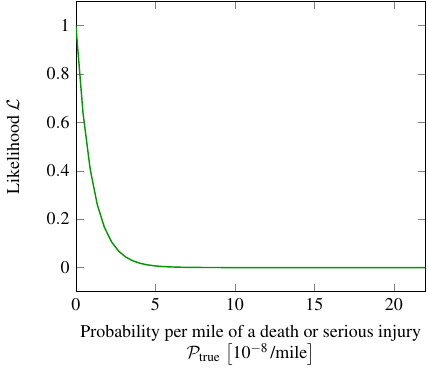
This time, an “event” is a death or serious injury. There are \(n = 0\) of them. That gives us the green curve in this graph:
My next step in the earlier post was to divide by the maximum likelihood and take the logarithm, giving
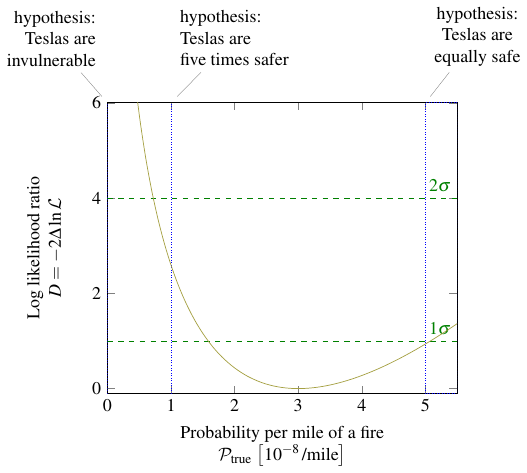
For fires, this gives a plot you might recognize from before,
whereas for deaths and serious injuries, the maximum likelihood estimate occurs at \(\mathcal{P}_\text{true} = 0\) and we get this:
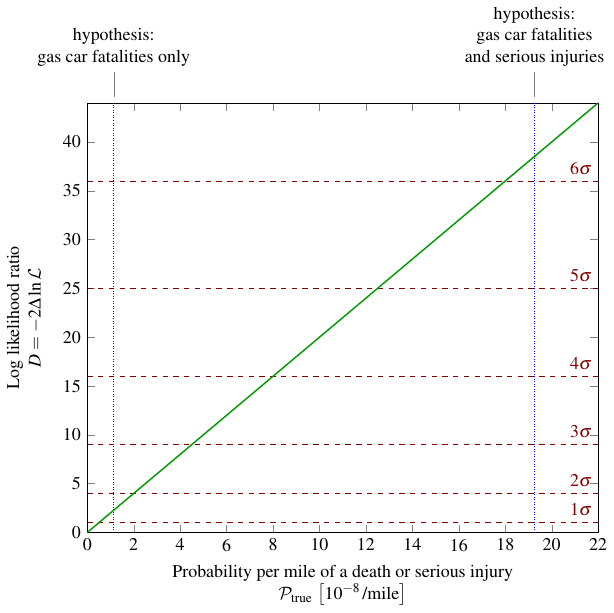
Interesting — it’s linear! This happens whenever the number of events observed is zero, as you can work out from the equations above:
(in case it bothers you, \(0^0 = \lim_{\mathcal{P}_\text{true}\mathcal{N}\to 0} (\mathcal{P}_\text{true}\mathcal{N})^0 = 1\)).
On that last graph, you’ll see that I marked two dotted vertical lines, indicating the two hypotheses I want to test. A little explanation of these hypotheses is in order, because there was a bit of work involved in coming up with them.
See, Tesla’s blog post says there has never been a death or a serious injury in a Tesla. So in order to figure out whether Teslas are statistically safer than normal cars, I need to look at the rate of fatalities and serious injuries in normal cars — basically that’s just the equivalent of \(\mathcal{P}_\text{true}\) for a gas car. The specific quantitative hypothesis we should try to reject can be stated like this:
The rate of fatalities and serious injuries in a Tesla is at least as great as the rate of fatalities and serious injuries in a normal car.
I can find from an NHTSA report (PDF) that in 2012, there were 1.14 deaths and 80 injuries per hundred million miles driven on US roads overall. Most injuries in traffic accidents are minor, though. So all that tells us is that the total rate of deaths and serious injuries was somewhere between 1.14 and 81 per hundred million miles. That’s a pretty wide range.
We can start by checking the boundaries of this range. First, consider the lower boundary, corresponding to \(\mathcal{P}_\text{true} = \SI{1.14e-8}{\per mile}\). In words it would be stated like this:
The rate of fatalities and serious injuries in a Tesla is at least as great as the rate of fatalities in a normal car.
This hypothesis is represented by the leftmost dotted line, which crosses the log likelihood curve (the green line) at \(D = 2.28\), which is not really that unlikely. Remember from my earlier post that \(D = 4\) (a.k.a. \(p = 0.05\)) is probably the most common threshold for statistical significance, albeit a rather weak one (you get it wrong 5% of the time), and this hypothesis doesn’t even meet that threshold. So if gas-powered cars had 1.14 deaths and serious injuries per hundred million miles, we would not be able to confidently say that Teslas are safer.
On the other hand, think about the upper boundary, corresponding to \(\mathcal{P}_\text{true} = \SI{81e-8}{\per mile}\). In words it would be
The rate of fatalities and serious injuries in a Tesla is at least as great as the rate of fatalities and all injuries in a normal car.
In this case, the relevant value \(\mathcal{P}_\text{true} = \SI{81e-8}{\per mile}\) is way off the right edge of the chart! A vertical line at that value of \(\mathcal{P}_\text{true}\) would cross the (green) log likelihood line at \(D = 162\), which is huge. That’s very unlikely. If that were the rate of deaths and serious injuries, we could conclude that Teslas are safer and effectively never be wrong. (The chance would be \(\num{4e-37}\). Check your understanding, if you like, by working this out from the cumulative distribution function of the chi-square probability distribution.)
Evidently, depending on just how many of those 80 injuries per hundred million miles are “serious,” we may or may not be able to reject the original hypothesis — remember, that means we may or may not be able to conclude that Teslas are safer than normal cars. So I did some digging into data provided by the National Highway Traffic Safety Administration to try to pin this number down. It turns out that every year, NHTSA investigators go out and collect a fairly large (around 60 thousand) sample of police reports about car accidents, and incorporate them all into a database called NASS, the National Automotive Sampling System. From the NASS/GES data for 2012, I was able to determine that out of the car accidents that year in which someone was injured (but not killed), 22.6% involved at least one serious injury (for what seems like a reasonable definition of serious). So it stands to reason that \(80\times 0.226 = 18.1\) is a reasonable estimate at the number of traffic accidents per hundred million miles that involved a serious injury.
Adding that figure of 18.1 to the 1.14 fatalities per hundred million miles, I get the overall estimate of deaths and serious injuries per hundred million miles to be 19.3. The corresponding hypothesis is that \(\mathcal{P}_\text{true} = \SI{19.3e-8}{\per mile}\), and that is marked with the vertical dotted line at the right of the last graph. That line intersects the green log likelihood line at \(D = 38.5\), which exceeds any reasonable threshold for statistical significance — not only the common \(D = 4\) threshold, but also the \(D = 25\) (a.k.a. \(5\sigma\)) used in particle physics, and even the \(D = 36\) threshold (\(6\sigma\)) used in high-precision manufacturing. At this value of \(D\), we have only a one-in-two-billion chance of rejecting the hypothesis if it is in fact true.
So as far as we can tell from the statistics, we can pretty confidently state that Teslas are safer than gas-powered cars.