B meson decay and the calculation of cross sections
Posted by David Zaslavsky on — CommentsNow that I’ve finished my quest to identify the misbehaving sinc function, I can bring you the latest news from the Hadron Collider Physics conference in Kyoto, Japan. This is a major conference at which several new results from the LHC experiments are being announced — an exciting time for the physics world indeed!
B meson-muon decay
The most interesting result to come out of the conference so far is an observation by the LHCb experiment of a \(\mathrm{B}^0_s\) meson, made of bottom and antistrange quarks, decaying to a muon-antimuon pair. This is a reaction that physicists have been searching for since 1987. This year, the LHCb collaboration has actually seen it happen — or at least, they’ve collected enough statistical evidence to be fairly confident (\(3.5\sigma\)) that it does happen — for the first time.
It’s not quite as dramatic a discovery as that makes it sound, though; the reason \(\mathrm{B}^0_s\to\mu^+\mu^-\) has never been seen before is that it’s incredibly rare. B mesons are not exactly easy to produce, and then once you’ve got one, the standard model predicts that only one out of every 300 million will decay into a muon pair! So physicists knew years ago that, if the standard model is correct, they wouldn’t be seeing evidence of this decay until about this time. It’s not like the Higgs boson, which could plausibly have been detected at pretty much any time in the 40 years since its prediction because nobody had any idea what its mass was.
But wait — note that I said “if the standard model is correct.” This is the other thing that makes this result so interesting: the fact that it hasn’t been seen until now indicates that there is probably nothing acting to increase the rate of this reaction above the standard model prediction. That in turn rules out a lot of ideas about how to extend physics beyond the standard model, including many supersymmetric theories.
Calculation of the decay probability
I thought I’d explain a little about how this works. When you set out to calculate how often a particular reaction should happen using quantum field theory, in practice, you do it by adding up mathematical expressions corresponding to all the ways the reaction can occur.
\(A\), \(B\), \(C\), etc. represent these mathematical expressions. (It’s worth keeping in mind that this is only an approximate method, but one that works quite well in practice.) Of course, nobody likes to have to juggle lots of arcane mathematical expressions, and so physicists — well, mostly one particular physicist — came up with a way to represent these mathematical expressions by little pictures, Feynman diagrams. Each diagram shows one possible way the reaction can occur. (Sort of. You can’t quite interpret this literally, but it comes pretty close.)
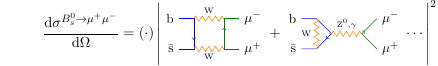
This picture, adapted from Gino Isidori’s presentation shows the two Feynman diagrams that contribute most strongly to the cross section of the B meson to muon-antimuon decay. Again, you shouldn’t take this too literally, but you can basically think of the processes shown as follows:
- The bottom and antistrange quarks annihilate and turn into a pair of W bosons which then annihilate and turn into a muon and antimuon
- The bottom and antistrange quarks exchange a W boson and turn into a top-antitop quark pair, which annihilate to produce a Z boson or photon, which decays into a muon and antimuon
Each diagram represents a mathematical expression which evaluates to a number, and you can calculate the expression (and the number) from the diagram using a set of rules which I won’t go into here, because they could fill a book. The important point to take away is that this reaction is facilitated by a pair of W and/or Z bosons, and so the probability of this reaction happening to a particular B meson is determined by how strongly the various particles involved interact with those bosons. As the fundamental interaction gets stronger, the probability increases — kind of like how as gravity gets stronger, an apple is more likely to fall.
Of course, the two diagrams in the above expression are not the only ways a B meson can decay into two muons, but within the standard model, they’re the only ones that contribute significantly to the probability. However, if you allow physics beyond the standard model, i.e. if you suppose that there are other undiscovered fundamental particles out there, then perhaps there will be other diagrams involving those particles that also contribute a significant amount to the probability. That’s exactly what happens in many supersymmetric theories. And in that case, the expression for the cross section looks more like this:
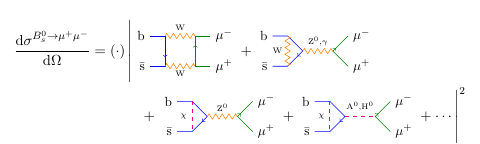
The additional diagrams included here involve additional Higgs bosons, \(\mathrm{A}^0\) and \(\mathrm{H}^0\), and any of a variety of new charged particles denoted by \(\chi\). Remember that each diagram represents a number, and so when you add more numbers together, you get a larger overall probability for this decay to occur. (Yes, diagrams can represent negative or complex numbers, so they could cancel out, but not in this case.) The process \(\mathrm{B}^0_s\to\mu^+\mu^-\) is particularly sensitive to physics beyond the standard model — in other words, a lot of the undiscovered particles that people have predicted get involved in Feynman diagrams that will significantly change the probability of this decay.
Details of the LHCb result
With an understanding of Feynman diagrams in mind, let’s look at the actual measurement from LHCb. Here’s a plot from Johannes Albrecht’s presentation on behalf of the collaboration showing the number of muon-antimuon pairs actually observed in 2012 as a function of their energy, and how they are expected to break down into different physical processes:
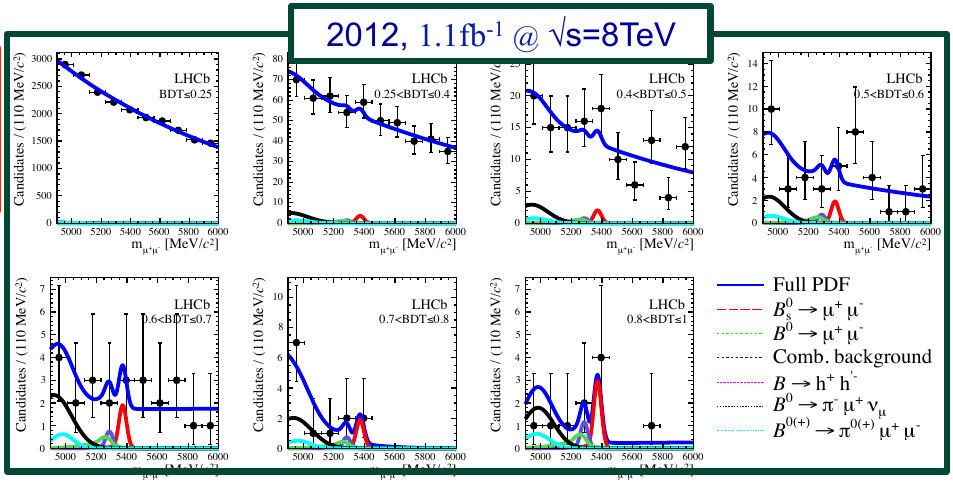
The red line shows the predicted contributions from \(\mathrm{B}^0_s\to\mu^+\mu^-\). It’s not entirely clear just from the graphs that there is a peak in the data there, but you can see some hints of an effect in some of the plots.
The measurement only really becomes clear when you put all the data together and run the statistical analysis. Using the CLs method, the collaboration came up with this plot:
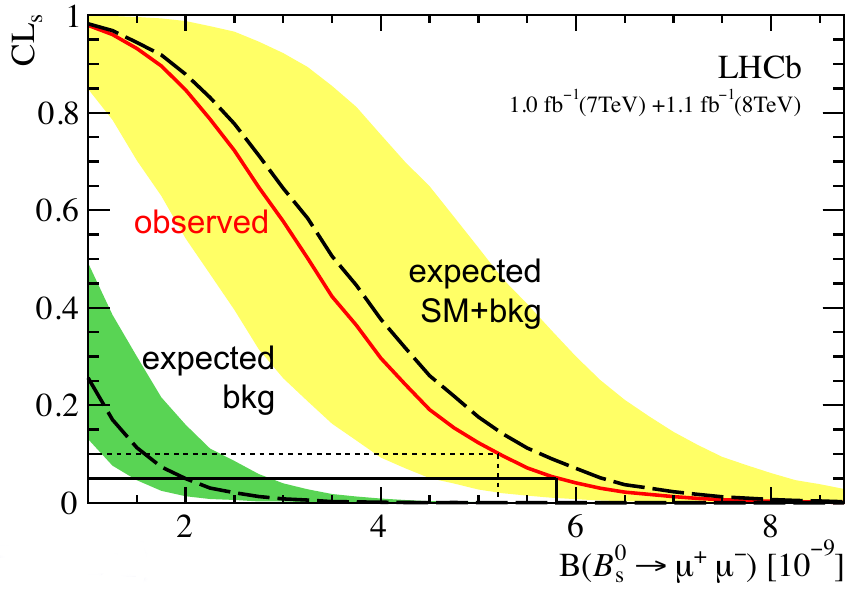
You can see just how closely the observed results match the expectations from the standard model, and how clearly they don’t match the background expectation (what would be measured if this decay didn’t happen at all). The actual measured result for the branching ratio (the probability that a \(B_s^0\) will decay to a muon-antimuon pair, that 1 in 300 million figure I quoted near the beginning) is \(\bigl(3.2_{-1.2}^{+1.5}\bigr)\times 10^{-9}\), which excludes the background-only hypothesis at a p-value of \(5\times 10^{-4}\) — in other words the probability that the LHCb collaboration would have seen what they did, if \(\mathrm{B}^0_s\to\mu^+\mu^-\) did not occur, is only 0.0005, so it seems pretty darn likely. This is what counts as an observation of the decay. The measured branching ratio also agrees with the prediction from the standard model of \((3.54 \pm 0.30)\times 10^{-9}\).
So to sum up, LHCb has two individually interesting results: that this decay is happening, and that it probably isn’t happening more than would be expected. While it’s a little disappointing that they haven’t discovered a distinct sign of new physics, this is still an exciting result because it shows just how tricky it’s going to be to discover whatever new physics is out there.